

Portals
- Grundfos Building Connect
- Grundfos iGRID
- Grundfos Connect Portal
- Grundfos Customer Portal
Grundfos iGRID lowers temperatures and pressures in district heating networks to exactly what each part of the city needs. For more than four years we have designed the customer portals where utilities and facility managers watch, trust and act on that intelligence.
The iGRID customer portal · zone station view
long-term partnership with Grundfos
projects
The client
Grundfos was founded in Bjerringbro in 1945 and today makes pumps and water solutions for buildings, utilities and industry all over the world. Heating is where it all started, and district heating is where Grundfos is now pushing hardest on energy efficiency.
founded by Poul Due Jensen in Bjerringbro
pump manufacturer in the world
colleagues across the globe
owned, profits go to science and water
MAGNA3 circulators, TPE3 in-line pumps and Hydro MPC boosters for heating, cooling and water in commercial buildings.
Plant pumps, CUE drives, mixing loops and the iGRID solution for utilities that distribute heat to whole cities.
Pumps, dosing and digital services for drinking water and wastewater across networks and treatment plants.
CR multistage pumps and solutions for process water, boilers and machine tools.
Understanding iGRID
A district heating network is sized for the building that needs the hottest water and the highest pressure. The old hospital block sets the temperature for the whole city, and the new low-energy district gets water it can’t use. The extra heat leaks into the ground through kilometres of pipe.
A pre-fabricated mixing loop that splits the city into zones and blends return water in, so each zone gets exactly the temperature it needs.
Calculates the lowest safe supply temperature from real-time data, weather forecasts and learned consumption patterns, and pre-heats before morning peaks.
Uses differential pressure at critical points to run the plant pumps only as hard as the network needs.
Wireless sensors in buildings and pits, powered by a thermoelectric generator. They report temperature, flow and pressure every minute.
NIS2-compliant cloud with open protocols. Data can be used in the portal or fed into the utility’s own SCADA.
Try it yourself
A simplified network with one plant and five neighbourhoods. Drag the outdoor temperature and switch between a traditional grid and iGRID. The critical points still get the pressure they need; the rest of the heat stays in the pipes.
Illustrative model built for this case. Real savings depend on the grid, the zones and the consumers.
Plant supply
Heat loss in the network
−18 % saved
Plant pump power
−34 % saved
Critical point ΔP
Who we design for
The iGRID portal serves district heating utilities that run the network around the clock. The Commercial Building portal serves facility managers who look after pumps in offices, hotels and logistics centres, often as one job among many.
iGRID customer portal
Operations manager
“Is the grid running as efficiently as it can, and can I prove it to the board?”
Control room operator
“What changed, why did the optimiser do it, and do I need to step in?”
Field technician
“Which measure point, which address, and what do I bring?”
Commercial Building customer portal
Facility manager
“Are all my pumps healthy across all my buildings, right now?”
Energy manager
“Where are we using more energy than we should, and what is it worth?”
Service partner
“What exactly is wrong with this pump before I drive out?”
Field research
You can’t design for a control room from a meeting room. We visited district heating plants, sat next to operators on their shifts and ran in-depth interviews with key people across the industry. The observations shaped every screen that followed.
Physical visits to district heating plants to see the control rooms, the SCADA screens and the pump halls where decisions are actually made.
Long conversations with operations managers, operators and technicians about their routines, their worries and their workarounds.
Shadowing people through real shifts: what they check first, what they print out, and when they pick up the phone.
What we learned
Operators live in their SCADA. The portal has to add insight and not compete with the screen they already trust.
Nobody hands a city’s heat to an algorithm they can’t follow. Every automatic setpoint change needs a visible reason.
The question is always whether the weakest point in the grid gets enough pressure and heat. It had to be visible at a glance.
The 06:00 peak on a cold weekday is when the grid is under the most stress. The forecast view was designed around it.
How we work
We mapped existing workflows and user journeys for each role, including all the places they left the system to get work done.
Detailed wireframes for the network overview, zones, measure points and alarms, reviewed with Grundfos domain experts.
Interactive prototypes with realistic grid data, so users reacted to real numbers and not placeholder text.
Tested with utility and facility manager users, adapted and tested again, with changes going back into the design system.
Clear, reusable components for navigating complex data, shared by both portals and ready for the developers.
Drag to compare
The iGRID customer portal
Each iGRID zone station opens with its photo, location, alarm status and data freshness, followed by a live system diagram: supply and return, pressure and temperature on both sides of the mixing loop, and the mode of every pump and valve. Click through the replica and try remote control.
Zone 1
North pumping station
Nørregade 24, 8850 Bjerringbro
No alarms and warnings
All data updated 6 min. ago
Oct 22, 2024, 13:20:16
A calm, dark system view in the P&ID language operators know from SCADA, with live values on every sensor.
Alarms and data freshness sit at the top of every station, so an operator knows in a second whether to worry.
Pressure and temperature differences are calculated between supply and return, so the numbers that matter need no mental arithmetic.
Remote control changes modes and setpoints on site, and every command is logged in Events.
From the plant room to the screen
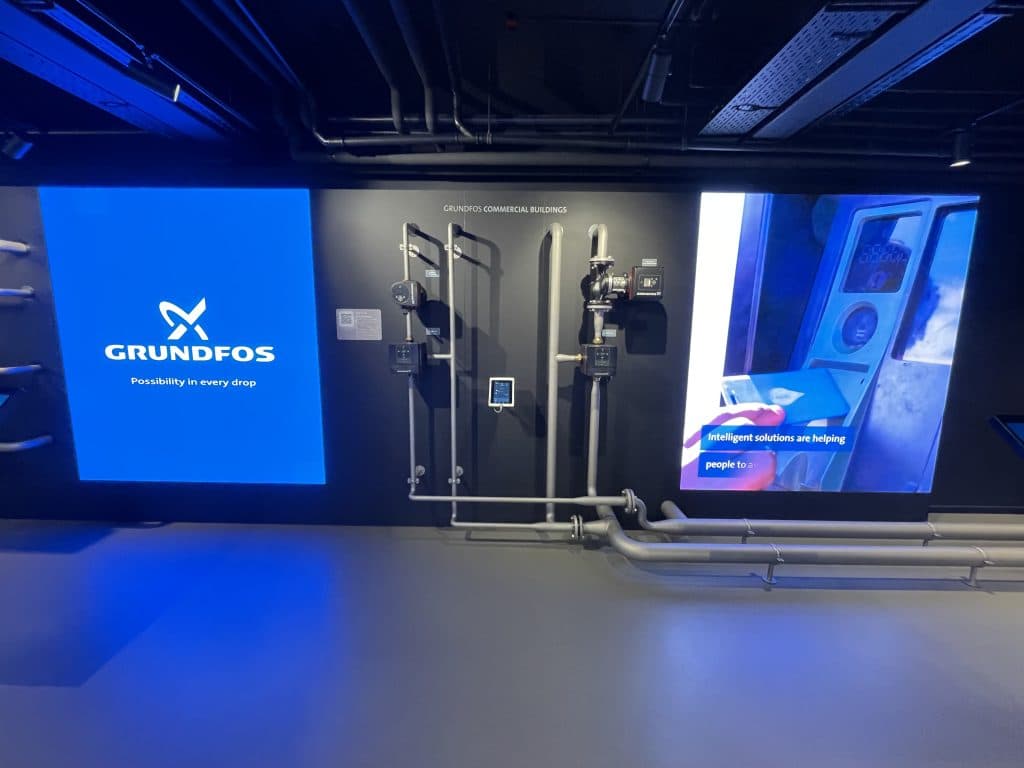
Grundfos shows the Commercial Buildings solution as a working installation: pumps, pipes and controllers on the wall, with the digital layer right next to it. That is the standard we designed the portal for. Every screen has to make sense next to the hardware it controls.
The Commercial Building customer portal
For facility managers, the portal starts with the question “is anything wrong?” and answers it for the whole portfolio before going into buildings, pumps and energy.
Commercial building
Domicil Havnefronten
Aarhus C · 18,400 m²
1 warning
All data updated 2 min. ago
Oct 22, 2024, 13:24:02
Chilled water pump running at 91 %
Cooling, chilled water · TPE3 50-240
The TPE3 has run above 90 % speed for 3 days. This often points to a clogged strainer or a stuck valve in the cooling circuit.
Check the strainer before the next warm day.
All buildings with energy, savings and open alarms, so the one that needs attention stands out.
Each pump shows its role in the building, not only its model number, with live speed, flow, head and power.
What happened, what it means for the building and what to do next, ready to forward to the service partner.
The UI components
Both portals are built from the same components. They were designed to stay readable with thousands of measure points and to behave the same way everywhere.
Sensor with value chips
Pump modes
Control valve
Line language
Status cards
No alarms and warnings
All data updated 6 min. ago
Oct 22, 2024, 13:20:16
Station header
Zone 1
North pumping station
Nørregade 24, 8850 Bjerringbro
Tab bar
Pump card
The partnership
We have been part of many Grundfos projects, and the work reaches further than district heating. It spans the industry, pumps and controllers, and the digital products: portals, the display on the pump itself, apps and desktop tools, and a shared design system. Grundfos keeps coming back because we already know the domain. We know the pumps and controllers, the users and the systems, and we don’t start from scratch. Every project builds on the research, the components and the trust from the one before.
What the client says
We have worked with Ceptiv on several of our digital offerings, and they have become a natural part of the team. They move fast, turning ideas into new designs and clickable prototypes quickly, so we can test with customers early instead of debating on paper. They are great at bringing stakeholders together and never lose sight of the customer. If you are looking for a UX/UI partner with broad industry experience, a sharp eye for design and genuinely excellent collaboration, I can highly recommend Ceptiv.

What we delivered
That is exactly what we like. Tell us about your platform and we’ll show you how we would approach it.

Dennis Nielsen
Head of Operations, Ceptiv
Free consultation
Describe your project and I will contact you as soon as possible, so we can schedule a no-obligation meeting. You leave with practical advice on how to get your project off to a good start.
Or call us on +45 81 98 32 71